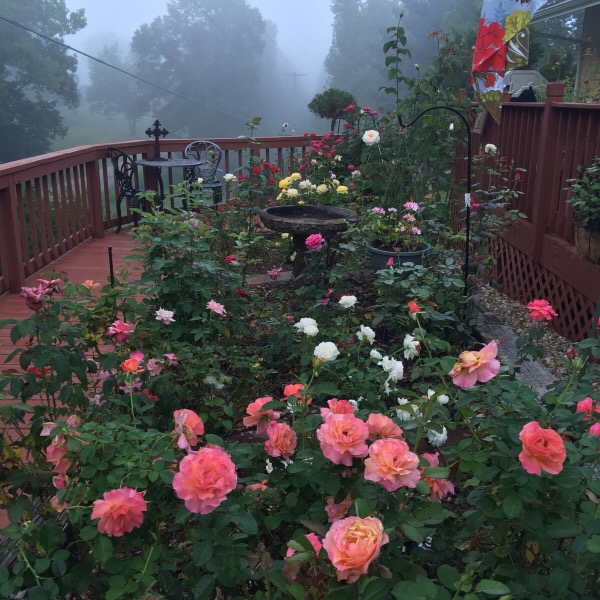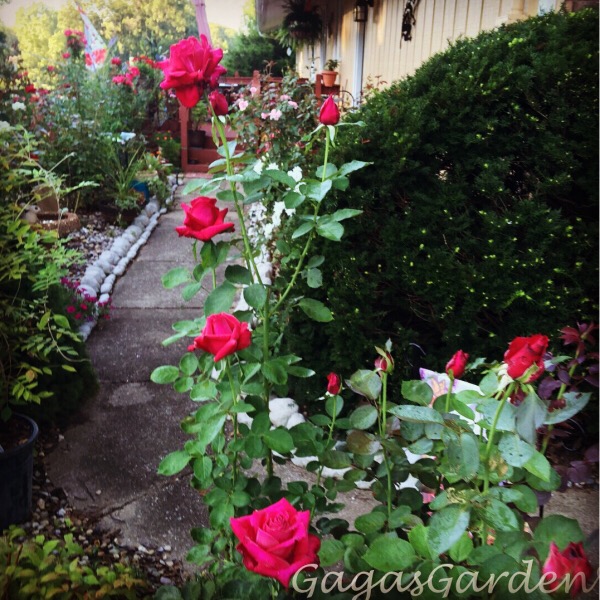
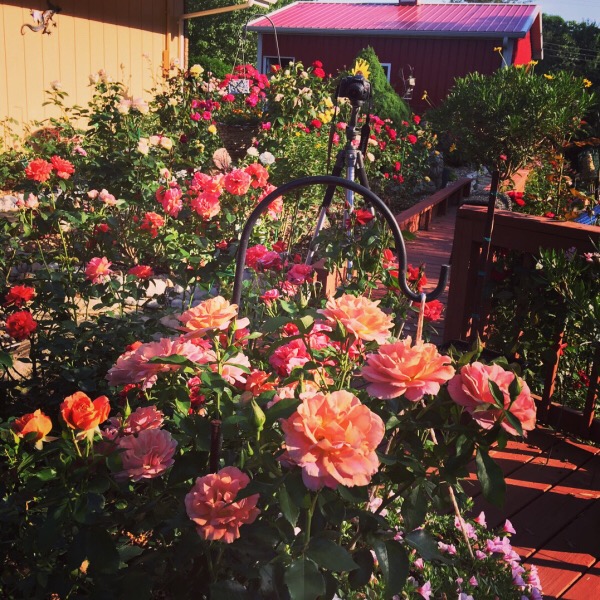
Rose bloom cycles have unique patterns of growth that are distinguishable upon a visual registry of familiarity. A familiarity that is built on time and and meditative reflection together with your garden. What are some of the ways you can apply your own visualization system to describe the differences you see in your own microclimate? There are so many contributing factors occurring at different times yet the same variables continue to impact what you see. Only a visualization system can fully record the full effect. Your garden takes on distinguishable patterns of growth that are determined by these factors just to name a few.
- Dates of pruning
- Dead-heading promptness
- Fertilization schedule
- Water levels
- Sun
- Disease
- Draughts
- Pests
- Soil Type
- Care
-
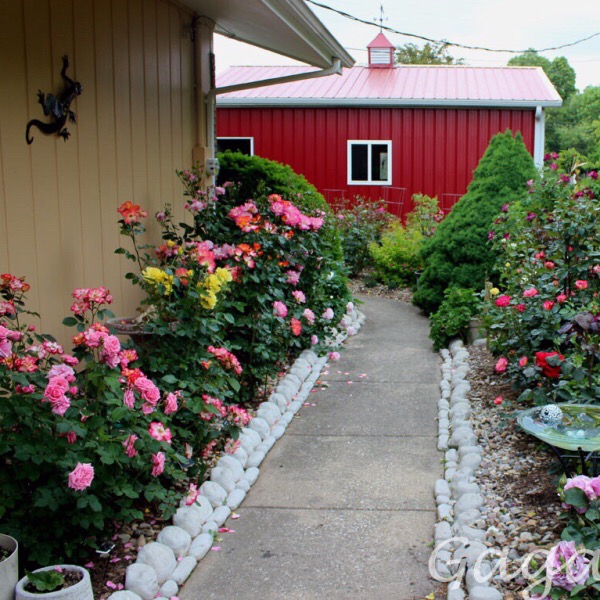
The Most Often Replicated Visualization Pattern: Gaga’s Garden Floribunda Rose Garden
As a former merchandiser I’ve suggested to gardeners that you keep a diary of historic natural events that impact your garden. All of our buying of merchandise was based on history. The same can be said for plans in your garden. Much of what will happen and your plans to purchase and budgets are based on historical data.

One of the most unusual patterns I’ve noticed in a visualization system of record keeping is that each rose bush no matter how it’s pruned grows back in the same symmetry. Year in and year out established bushes will recreate a pattern of growth quite similar if not almost the same in symmetric patterning. The genetic code reproduces an almost perfect replica of itself after a winter dormancy year in and year out. A mystery to me and yet one I observe and is part of my visualization system.
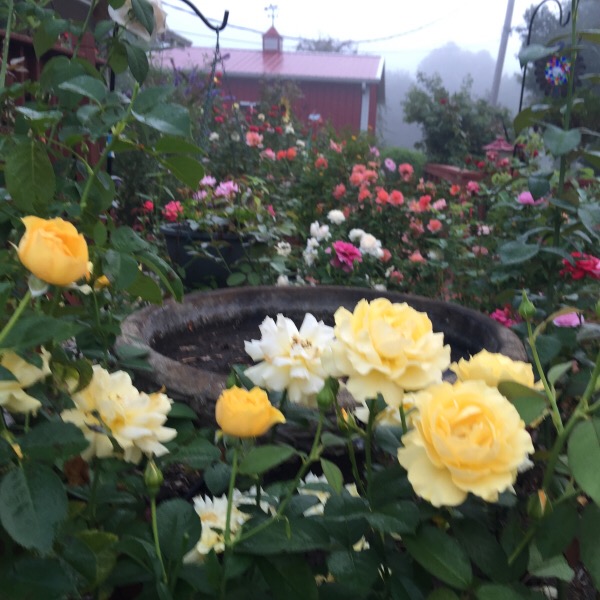
For your visualization system start a journal and take note of the varieties that are most likely to have the most similar growth patterns. Record these things:
- What do you like about the growth characteristics?
- Does the plant generate the same number of canes each year?
- When do basal breaks occur?
- What contributing factors change the plant growth pattern?
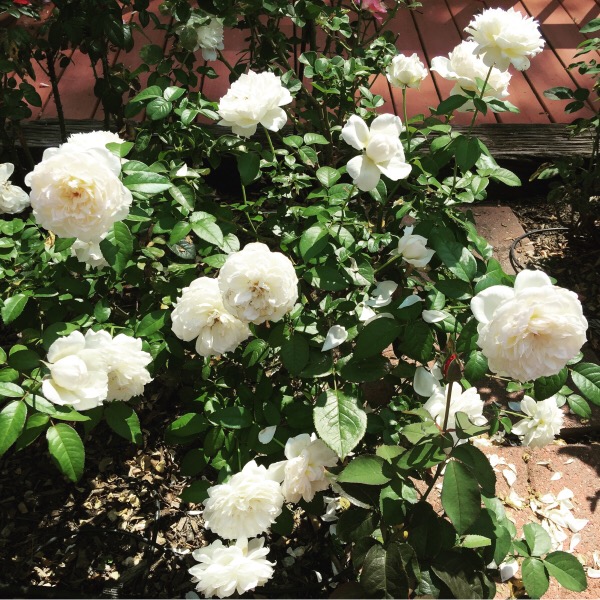
‘Bolero’
